TradingView indicator · GC & MGC · 5-minute
Gold Session Objective Map
See how far gold has tended to travel in a session, drawn as objective levels from the opening range. It shows extent, not direction, so you can place targets and judge how much room a move has left.
The problem it solves
Gold sessions vary a lot in how far they run. Without a reference you end up guessing where to take profit, or chasing a move that has already travelled most of its usual range. The Session Objective Map turns the session's opening range into a small set of objective levels, calibrated from recently completed sessions, so you have a consistent yardstick each day.
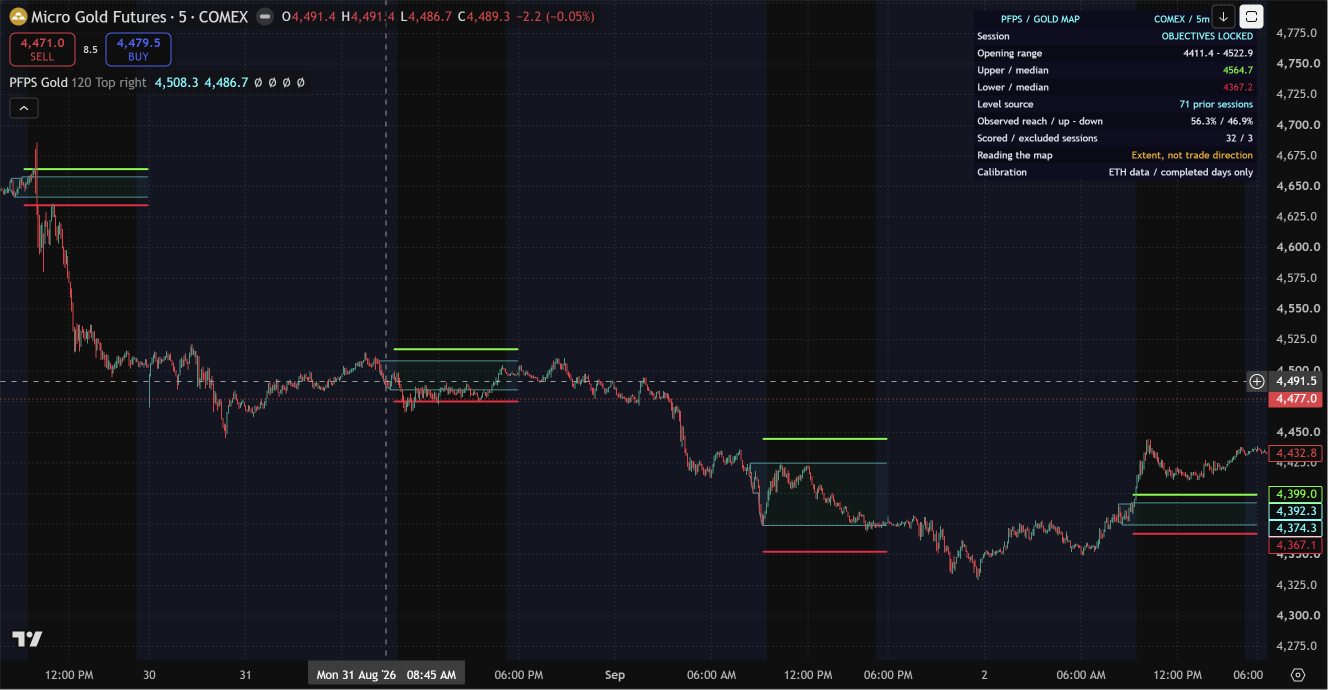
What's on the chart
- Grey box for the session's opening range.
- Green line above and red line below for the session objectives, drawn once the opening range is set.
- A dashboard with the levels as numbers and roughly how often price has reached them.
- Optional outer objectives for stretch days.
How traders use it
Targets
The green objective is a natural place to take profit on a long, the red one on a short. You choose the entry.
Room check
Price already at the far objective suggests a mature move. Price still near the box suggests room to run.
Trend or fade
Opening range breaks and holds: the upside objective is in play. Chopping inside the box: treat the levels as fences.
Day type
Price blowing through an objective early points to a strong trend day.
Settings and alerts
Inputs: completed sessions used for calibration (default 120), show outer objectives, show opening range, show labels, show dashboard, and dashboard corner. Five alert conditions are included: opening range locked, first break of the opening high, first break of the opening low, upper objective reached, lower objective reached. Alerts are confirmed at bar close.
Limitations and caveats
- It is not an entry signal and it does not predict direction.
- The nearer objective is reached on most sessions; the outer ones much less often. Treat the near level as the default expectation and the outer levels as stretch.
- Some days overshoot the far level and some never reach the first. That is normal range behaviour.
- Built for GC and MGC on the 5-minute chart. It needs enough completed sessions loaded on the chart to calibrate.
- It cannot enforce a prop firm's drawdown or daily-loss rules. Check your firm's current rules yourself.
Who it is for: discretionary and systematic futures traders who trade gold and want a consistent range reference. Who it may not suit: anyone looking for buy and sell signals.
Install
- Create a free account and add your TradingView username.
- Start the free trial or subscribe. We invite your username to the script within 24 hours.
- Accept the invite from your TradingView notifications.
- Open a GC or MGC 5-minute chart, then add the script from Indicators → Invite-only scripts.
Pricing
$40 / month
One subscription covers the Gold Session Objective Map and the NQ Session Ignition Map, with future indicators added at no extra cost. Cancel anytime. Secure Stripe checkout.
SubscribeTry it free for 7 days
Questions
Does the Gold Session Objective Map tell me whether to buy or sell?
No. It projects how far gold has tended to travel in a session, not which way. Both an upper and a lower objective are drawn every day. It is not an entry signal and does not predict direction.
Which instruments and timeframe is it built for?
Gold futures: GC and MGC, on the 5-minute chart. It is not designed for other markets.
Does it repaint or use future data?
The objectives are calibrated only from completed prior sessions and are fixed once the opening range finishes. The script uses no request.security calls, so there is no higher-timeframe lookahead. Alerts are confirmed at bar close.
What can I change in the settings?
The number of completed sessions used for calibration (default 120), whether to show the outer objectives, the opening range box, the objective labels, and the dashboard, and which corner the dashboard sits in.
What alerts does it include?
Five: opening range locked, first opening-high break, first opening-low break, upper objective reached, and lower objective reached. All are context events, not buy or sell signals.
Will it help me pass a prop firm evaluation?
It can help you plan targets and judge how much room a move may have. It cannot enforce drawdown or daily-loss rules, and no indicator guarantees an evaluation result.
How do I get it and what does it cost?
It is included in the $40/month Indicators subscription together with the NQ Session Ignition Map, cancel anytime. Access is by invite on TradingView within 24 hours. A 7-day free trial is available with a free account.
Related
Indicators provide chart context. They do not place trades, give financial advice, or enforce any prop firm rule, and they do not guarantee results.