TradingView indicator · NQ & MNQ · 15-minute
NQ Session Ignition Map
The first 15 minutes of the NQ regular session set a range that locks for the day. This indicator draws it and marks the level where price either commits or doesn't, so you can read the day's character at a glance.
The problem it solves
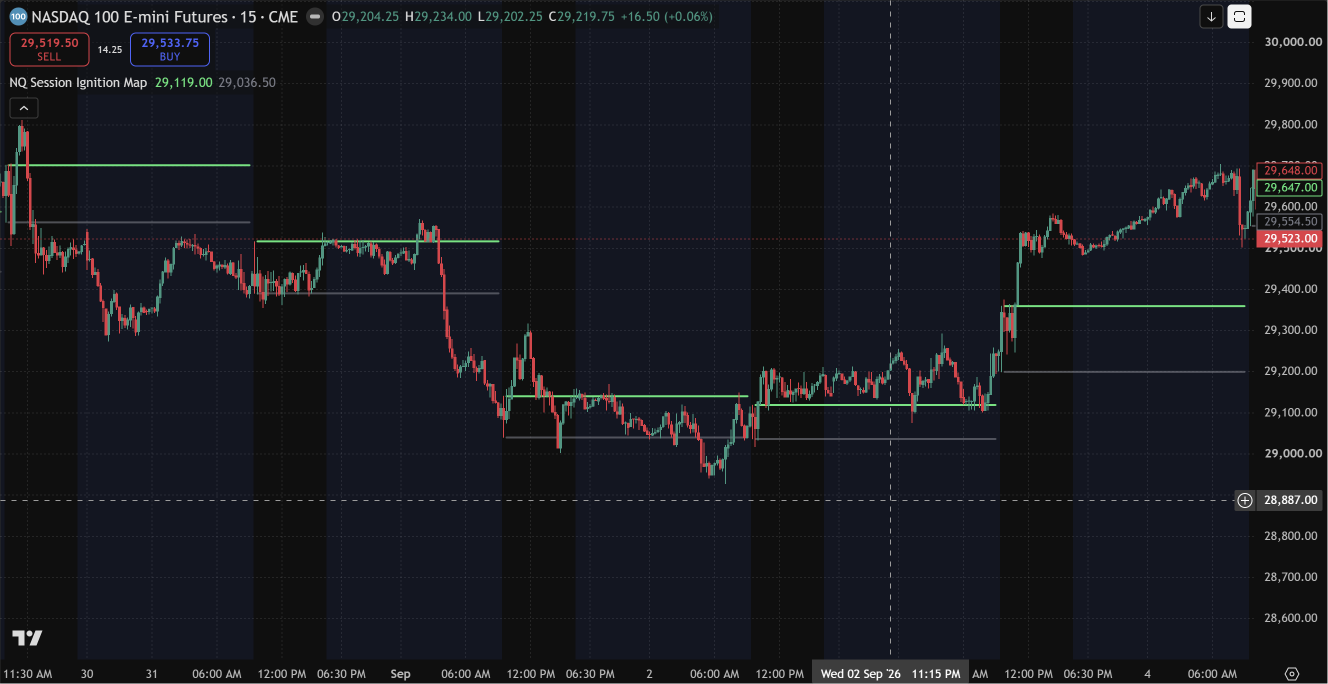
The opening minutes often set the tone for the NQ session, but it is easy to lose track of where that range actually ended once the day gets busy. The Session Ignition Map locks the 9:30 to 9:45 ET range at 9:45 and keeps it on the chart, so there is one fixed level to judge the session against.
What's on the chart
- Grey box for the first 15 minutes of the regular session.
- Green line at the ignition high. It locks at 9:45 ET and does not move for the rest of the day.
- Grey line at the ignition low, for reference and orientation.
How traders use it
The break
A candle that closes above the green line (body, not a wick) is the launch read, and the level you trade long against.
Hold or chop
Closes above and stays above suggests a trend day. Flip-flopping across the line suggests no commitment, so stand aside.
The low line
Use it for stop placement and orientation. It is not a short trigger, and breaks below it don't behave the same way.
Already gone
Price well above the green line at 9:45 means the move happened without you. Skip it.
Settings and alerts
There are no adjustable inputs. One alert is included, "NQ Ignition Level Broken". If you use it, set it to Once Per Bar Close so it only fires on a confirmed close above the level.
Limitations and caveats
- It is not a short signal on the grey line and not an every-day trade. Plenty of sessions never break cleanly.
- A break is not a promise it runs. Some fail and come back.
- Built for NQ and MNQ regular-session hours on the 15-minute chart.
- It cannot enforce a prop firm's drawdown or daily-loss rules. Check your firm's current rules yourself.
Who it is for: discretionary futures traders who trade the NQ open and want a fixed reference level. Who it may not suit: anyone looking for a fully automated signal or a short-side trigger.
Install
- Create a free account and add your TradingView username.
- Start the free trial or subscribe. We invite your username to the script within 24 hours.
- Accept the invite from your TradingView notifications.
- Open an NQ or MNQ 15-minute chart, then add the script from Indicators → Invite-only scripts.
Pricing
$40 / month
One subscription covers the NQ Session Ignition Map and the Gold Session Objective Map, with future indicators added at no extra cost. Cancel anytime. Secure Stripe checkout.
SubscribeTry it free for 7 days
Questions
Is the NQ Session Ignition Map a buy or sell signal?
No. It marks where the session's opening range ended and lets you see whether price has committed above it. The green line is a reference level. The grey line is for stop placement and orientation, not a short trigger.
Which instruments and timeframe is it built for?
NQ and MNQ on the 15-minute chart, using the regular session's first 15 minutes (9:30 to 9:45 ET).
Does it repaint?
The ignition range accumulates only between 9:30 and 9:45 ET and locks at 9:45, after which it does not move for the day. The script uses no request.security calls. Set any alert to Once Per Bar Close so it does not flicker intrabar.
Can I change its settings?
No. The indicator has no adjustable inputs. It is a fixed, simple reference tool.
What alert does it include?
One: NQ ignition level broken, which fires when a bar closes above the locked ignition high after it was at or below it on the prior bar.
Does every day produce a clean setup?
No. Many sessions give one clean break or none, and some breaks fail and return. Do not force the days that are not there.
How do I get it and what does it cost?
It is included in the $40/month Indicators subscription together with the Gold Session Objective Map, cancel anytime. Access is by invite on TradingView within 24 hours. A 7-day free trial is available with a free account.
Related
Indicators provide chart context. They do not place trades, give financial advice, or enforce any prop firm rule, and they do not guarantee results.